 1800 605-5127
 +61 (0)8 8352 7711
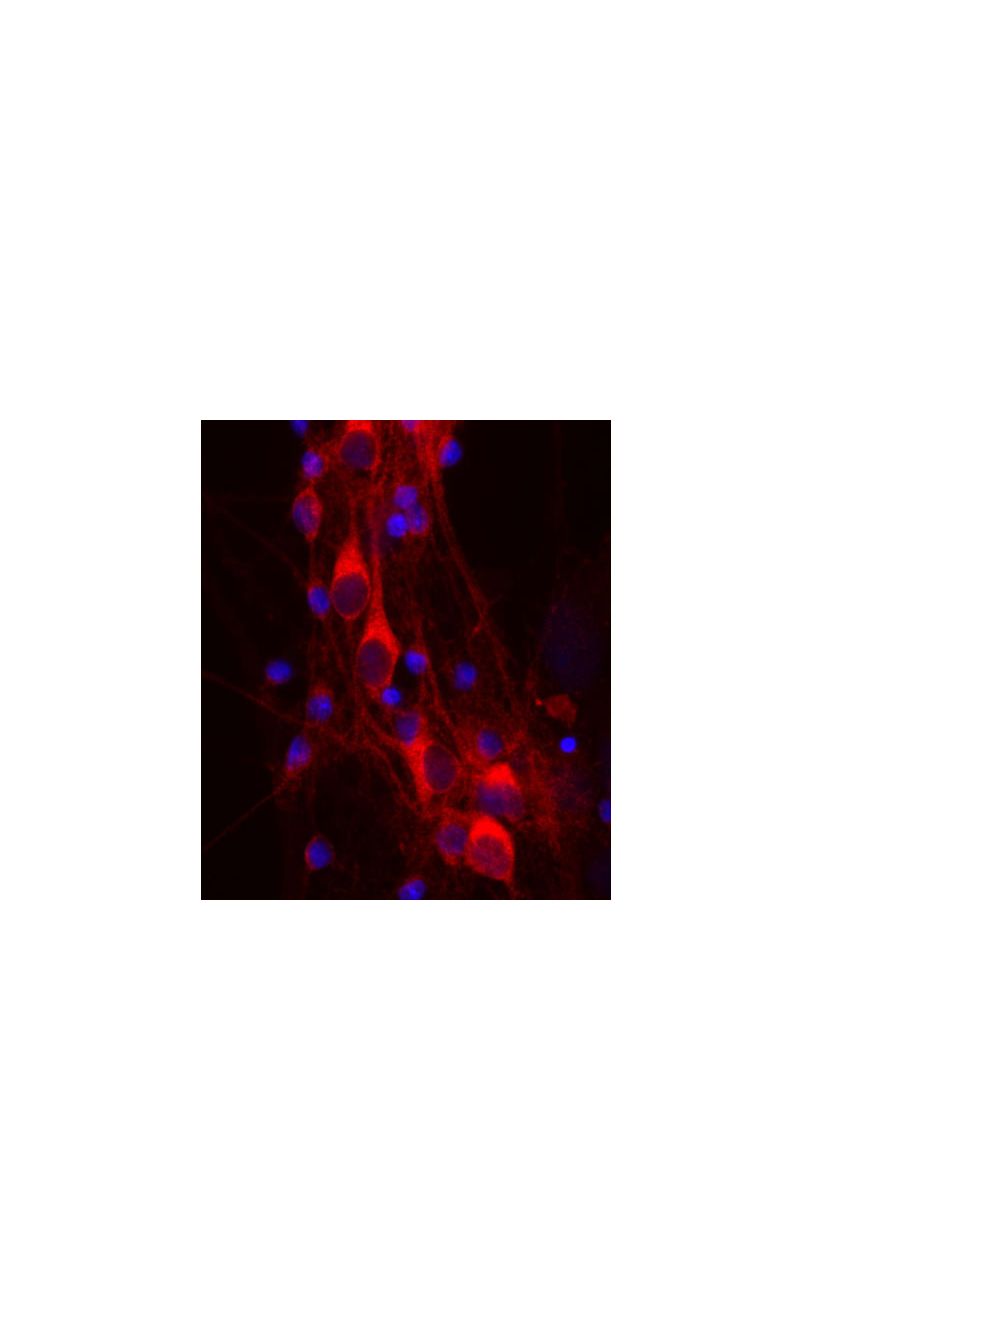

14-3-3 protein eta, Mouse Monoclonal Antibody
- Product Name 14-3-3 protein eta, Mouse Monoclonal Antibody
- Product Description Mouse anti-14-3-3 protein eta Monoclonal Antibody (Unconjugated), suitable for WB, IHC-Frozen, ICC.
- Alternative Names 14.3.3 ; Protein AS1; YWHAH; YWHA1; tyrosine 3-monooxygenase; tryptophan 5-monooxygenase activation protein 1;
- Application(s) ICC, IHC-Frozen, WB
- Antibody Host Mouse
- Antibody Type Monoclonal
- Specificity Human 14-3-3 ETA protein
- Species Reactivity Human, Mouse, Rat
- Immunogen Description Full length recombinant 14.3.3 protein ETA expressed in and purified from E. coli.
- Conjugate Unconjugated
- Purity Description Protein G purified
- Regulatory Status For research use only.
Product Info
- Product Description Mouse anti-14-3-3 protein eta Monoclonal Antibody (Unconjugated), suitable for WB, IHC-Frozen, ICC.
- Application(s) ICC, IHC-Frozen, WB
- Application Details WB, ICC, IHC. Suggested dilution of 1:500-1:1,000 for IHC and ICC. Suggested dilution of 1:1,000-1:5,000 for WB. A suitable control tissue is rat spinal cord or peripheral nerve homogenate.
- Target 14-3-3 protein eta
- Specificity Human 14-3-3 ETA protein
- Target Host Species Human
- Species Reactivity Human, Mouse, Rat
- Antibody Host Mouse
- Antibody Type Monoclonal
- Antibody Isotype IgG
- Clone Name 3G12
- Conjugate Unconjugated
- Immunogen Description Full length recombinant 14.3.3 protein ETA expressed in and purified from E. coli.
- Purity Description Protein G purified
- Format Lyophilized from PBS buffer pH 7.2-7.6 with 0.1% trehalose, and sodium azide
- Reconstitution Instructions Spin vial briefly before opening. Reconstitute with 100 µL sterile-filtered, ultrapure water to achieve a 1 mg/mL concentration. Centrifuge to remove any insoluble material.
- Storage Instructions After reconstitution of lyophilized antibody, aliquot and store at -20°C for a higher stability. Avoid freeze-thaw cycles.
- Batch Number Please see item label.
- Expiration Date 12 months after date of receipt (unopened vial).
- Alternative Names 14.3.3 ; Protein AS1; YWHAH; YWHA1; tyrosine 3-monooxygenase; tryptophan 5-monooxygenase activation protein 1;
- Uniprot Number Q04917
- Uniprot Number/Name Q04917 (1433F_HUMAN)
- Scientific Background 14.3.3 protein eta or 14.3.3 binds to a large number of partners, usually by recognition of a phosphoserine or phosphothreonine motif. Binding generally results in the modulation of the activity of the binding partner (Ref SwissProt). 14.3.3 protein eta is widely expressed as both homodimers and heterodimers and are concentrated in the nervous system. High concentrations of 14.3.3 protein eta have been linked to Creutzfeld Jacob Disease, Parkinson's Disease and early-onset schizopherenia.
- Shipping Temperature 25°C (ambient)
- UNSPSC CODE 41116161
- Regulatory Status For research use only.

